
 Description
 Table of Content
Report Overview
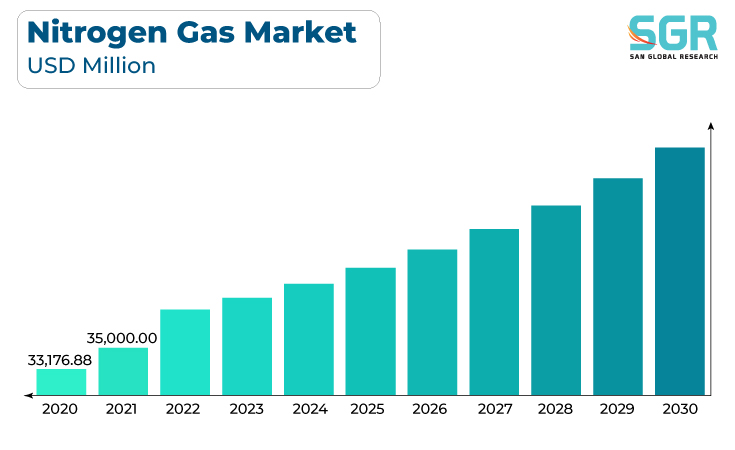
The nitrogen gas market was valued at 36,862.05 million in 2022 and expected to grow at CAGR of 5.9% over forecast period.
Nitrogen gas is widely used in various industrial applications, including chemical manufacturing, metal processing, electronics, and food packaging. The growth of these industries drives the demand for nitrogen gas. Moreover, the food and beverage industry use nitrogen gas for packaging to extend product shelf life and maintain product freshness. As consumer demand for packaged and processed foods continues to grow, so does the demand for nitrogen gas.
Furthermore, Nitrogen gas is used in pharmaceutical manufacturing and healthcare applications, such as cryopreservation and medical equipment. The growth of the pharmaceutical and healthcare sectors contributes to increased nitrogen gas demand.
In metal fabrication and welding applications, nitrogen gas is used to prevent oxidation and improve the quality of welds. The growth of the automotive and construction industries, which rely heavily on metal fabrication, drives the demand for nitrogen gas.
Application Outlook
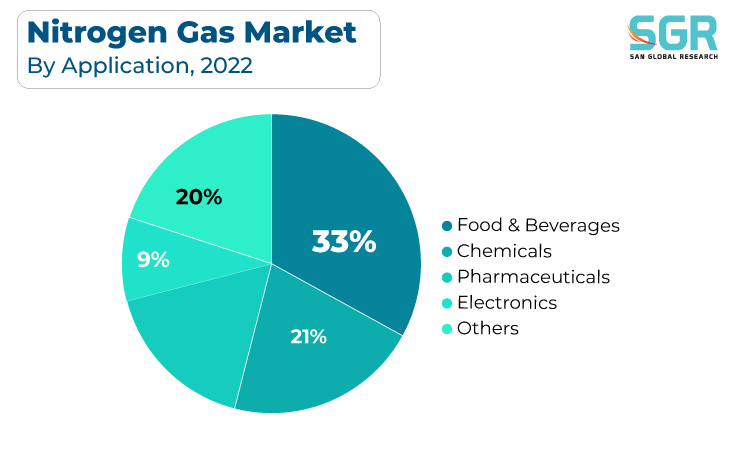
Based on application, the nitrogen gas market is segmented into food & beverages, chemicals, pharmaceuticals, electronics, and others. Food & beverages segment accounted for largest share in 2022. Nitrogen gas is commonly used in food packaging to extend the shelf life of perishable products. By replacing oxygen with nitrogen in packaging materials, the industry can reduce oxidative reactions and microbial growth, preserving the freshness and quality of food products. The demand for packaged and processed foods has been steadily increasing, leading to a growing need for nitrogen gas in packaging applications. Additionally, Modified atmosphere packaging, which involves the controlled use of nitrogen gas along with other gases (such as carbon dioxide and oxygen), is essential for preserving the quality and safety of a wide range of food products. This technology helps prevent spoilage, maintain flavor, and reduce the need for chemical preservatives, making it a preferred choice for many food manufacturers.
Thus, the growing consumer demand for packaged and processed foods, specialty beverages, and high-quality food products with extended shelf lives continues to drive the need for nitrogen gas in the food and beverage industry. As this sector expands and seeks to meet evolving consumer preferences, the demand for nitrogen gas is expected to grow, further fueling the growth of the nitrogen gas market.
Regional Outlook
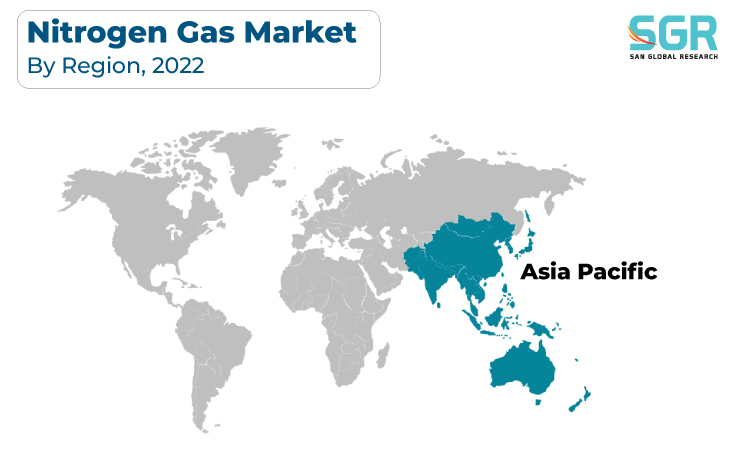
Asia-Pacific has emerged as leading market for nitrogen gas market in 2022. Several key factors are driving the Asia-Pacific nitrogen gas market such as the Asia-Pacific region has a growing population and a rising middle class, leading to increased consumption of processed and packaged foods and beverages. Nitrogen gas is crucial for food packaging and preservation in this industry. As consumer preferences for convenient and longer-lasting food products grow, so does the demand for nitrogen gas.
Furthermore, Agriculture is a major industry in many Asia-Pacific countries. Nitrogen gas is widely used in agriculture as a component of fertilizers. As these countries seek to improve crop yields and food production to meet the needs of their growing populations, the demand for nitrogen-based fertilizers and, by extension, nitrogen gas, continues to rise.
Hence, these factors collectively make the Asia-Pacific region a significant driver of the growth of the nitrogen gas market, as it experiences industrial expansion, increased agricultural production, and rising demand in key industries like food and beverages, electronics, and energy.
Nitrogen Gas Market Report Scope
| Report Attribute | Details |
| Market Value in 2022 | USD 36,862.05 Million |
| Forecast in 2030 | USD 58,122.98 Million |
| CAGR | CAGR of 5.9% from 2023 to 2030 |
| Base Year of Forecast | 2022 |
| Historical | 2018-2021 |
| Units | Revenue in USD million and CAGR from 2023 to 2030 |
| Report Coverage | Revenue forecast, Industry outlook, competitive landscape, growth factors, and trends |
| Segments Scope | By Application, By Form |
| Regions Covered | North America, Europe, Asia Pacific, CSA and MEA |
| Key Companies profiled | Air Products and Chemicals, Inc., Linde plc, Air Liquide, Messer Group, Taiyo Nippon Sanso Corporation (TNSC), Taiwan Nitrogen Company, Ltd., Gulf Cryo, Matheson Tri-Gas, Inc., Air Water Inc., Nippon Gases and SOL Group among others |
Global Nitrogen Gas Market, Report Segmentation
Nitrogen Gas Market, By Form
- Compressed Gas
- Liquid Nitrogen Gas
Nitrogen Gas Market, By Application
- Food & Beverages
- Chemicals
- Pharmaceuticals
- Electronics
- Others
Nitrogen Gas Market, Regional Outlook
North America
- U.S.
- Canada
- Mexico
Europe
- Germany
- UK
- Spain
- Russia
- France
- Italy
Asia Pacific
- China
- Japan
- India
- South Korea
- Australia
CSA
- Brazil
- Argentina
MEA
- UAE
- Saudi Arabia
- South Africa
 Gera Imperium Rise,
  +91 9209275355


